Article by Karl Sieg
 The best indicator of the cost of maintenance and construction of America’s surface transportation system may be the Construction Cost Index (CCI) of the Engineering News-Record. As of September 2014, the CCI is about double its 1993 value.
In 1993, Congress added 4.3 cents a gallon to the gasoline tax, with the added revenue dedicated to deficit reduction. With the addition of the 0.1-cent-a-gallon levy to finance the leaking underground storage tank trust fund, the federal tax rose to 18.4 cents a gallon. The federal Motor Fuel User Fee still stands at only 18.4 cents-a-gallon today.
Since 1997, the full federal gasoline tax has gone to the Highway Trust Fund.
 To prevent the Highway Trust fund from running out of money, Congress extended its life until May, 2015, through what some consider to be ‘gimmicks’ (see previous issues of this newsletter).
The federal government has been taxing our fuel for 82 years. From the beginning, the money was going to things other than roads and bridges. Most Americans favor an increase in the federal motor fuel user fee to adjust for inflation and costs from delayed maintenance and construction, assuming the money is actually used to build and maintain our surface transportation system. However, many of those Americans oppose an increase, due to a distrust of their public policy makers who they believe will vote to use it elsewhere.
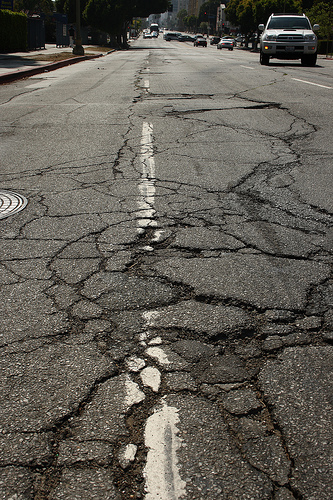
The image of ‘snake eyes’ above resembles a pair of eyes, which is appended to the term 'snake' because of the long-standing association of this word with treachery and betrayal. Because it is the lowest possible roll of the dice, and will often be a loser in many dice games, the term is a reference to bad luck.
So, what kind of luck will Americans have in the next 9 months?
Will your Congressman vote to ensure that the user fees you pay are used to build and maintain your transportation system?
How will you vote? Every Congressman is a candidate for re-election on November 4. Your vote is one of an estimated 200,000 construction industry votes in Western Pennsylvania. Your vote counts! A photo of your Congressman is at the bottom of the first page of the May issue of this newsletter (click here to see who's running in your district). The winners in the 2012 General Election and their margins of victory are shown in the December 2012 issue of this newsletter, on the Section website, above.
A recent projection is that only 18 percent of Philadelphia voters will turnout in the November 4 election, but 25% in metropolitan Pittsburgh. Since the Philadelphia Metropolitan Statistical Area (MSA) is 60% larger than the Pittsburgh MSA, the tepid turnout of Philly voters may make each vote in Western Pennsylvania more valuable.
